
This article, "The Potential Impact of Lease Accounting on Equity Valuation," originally appeared on CPAJournal.com.
Summary provided by MaterialAccounting.com: This article provides an overview of the way lease accounting will impact equity valuation. Examples are provided.
On February 25, 2016, FASB, in collaboration with the International Accounting Standards Board (IASB), released Accounting Standards Update (ASU) 2016-02, Leases (Topic 842), in order to improve the financial reporting for lease transactions. Effective for U.S. GAAP public companies with fiscal years and interim periods beginning after December 15, 2018, the new guidance will require companies that lease property or equipment to recognize assets and liabilities on the balance sheet for all leases with terms greater than 12 months. The change is intended to increase the transparency and comparability of lease-related material previously relegated to the notes.
Consistent with current GAAP, classification as a finance (capital) or operating lease will primarily dictate the measurement and recognition of cash flows and expenses associated with leases. FASB maintains a dual approach for income statement classification, wherein most existing operating leases will remain operating leases for purposes of income statement recognition. In contrast to the current GAAP requirement to recognize only capital leases on the lessee’s balance sheet, however, ASU 2016-02 requires both types of leases to be recognized. As a result, the quantity and quality of lessee disclosures will increase and better enable users of financial statements to evaluate the cash flow from leases.
CPAs will now be faced with new considerations when making decisions related to leasing transactions and the resulting financial statement presentation. Similar to capitalizing operating lease payments for business evaluation purposes, such as ratio analysis, current operating leases can also be capitalized to ascertain potential business valuation effects resulting from the new lease accounting. This article offers an example of equity valuation and examines the different results that arise from the new leasing standard effects that underlie adjustments to valuation model inputs and estimations.
Lease Example
Exhibit 1 presents the current year balance sheet, income statement, and additional financial information for a hypothetical business. When the company borrows money to purchase an asset, both the asset and associated debt appear on the balance sheet, and the company deducts the corresponding interest to determine net income. When the entity leases an asset from another business, under current leasing standards, the lessee will only disclose the lease commitments in the notes to the financial statements and recognize periodic rental expense associated with the lease on the income statement.
EXHIBIT 1
Financial Statements and Additional Information (dollars in millions)
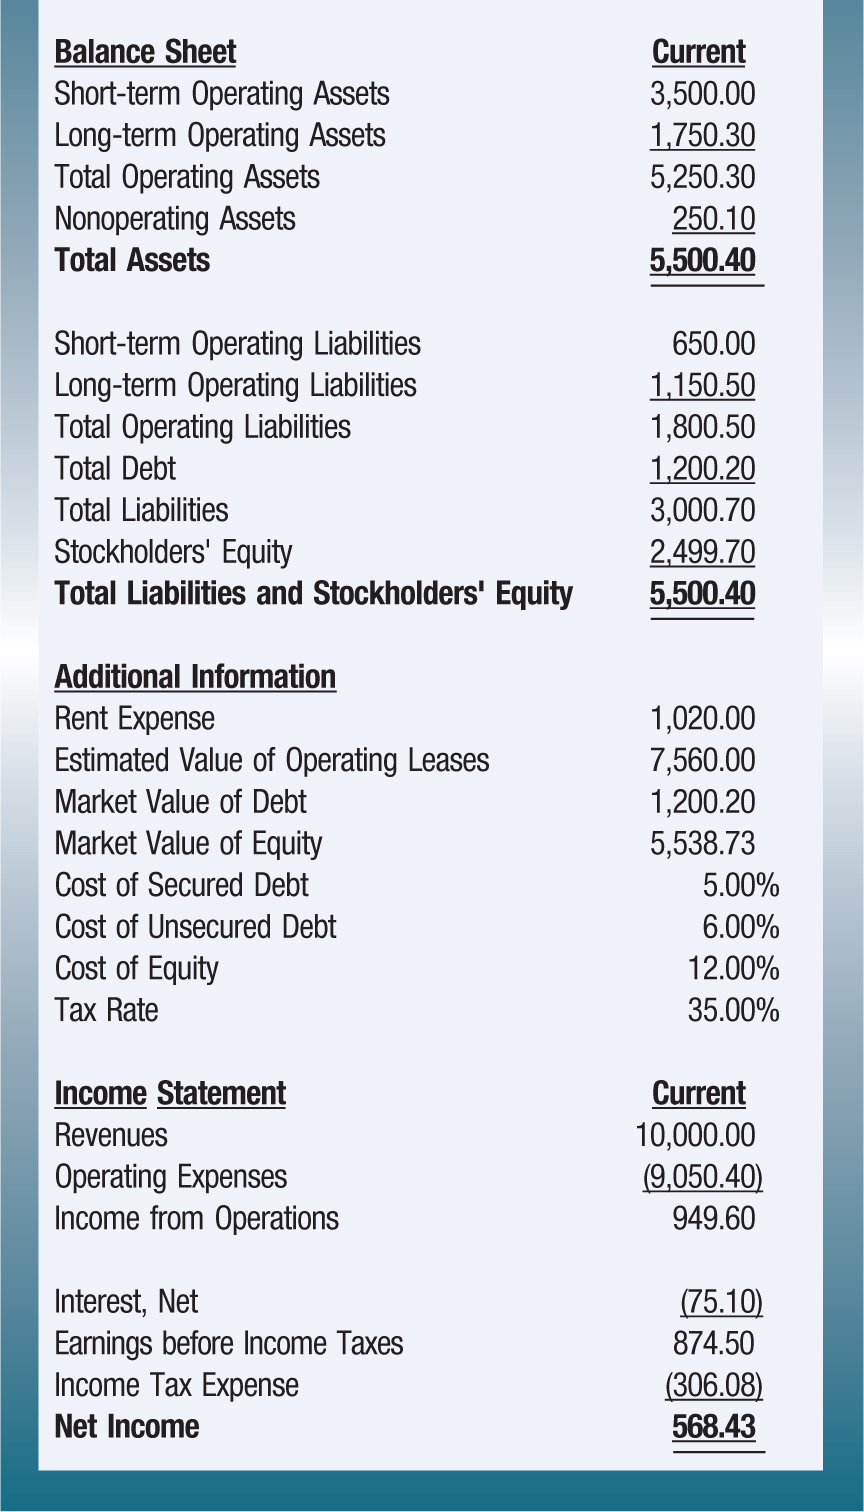
The hypothetical company is profitable with a mix of debt and equity financing. In addition, there is an assumed $7,560 million of property classified as operating leases and excluded from the balance sheet. This value would remain unreported in practice under current standards but can be estimated from note disclosures by determining a discount rate and computing the present value of future lease payments. The company reports $1,020 million in rent expense associated with the operating leases; this amount is included in the $9,050.40 million of operating expenses on the income statement and is typically reported in the notes rather than as a separate line item.
Lease Adjustments
By capitalizing operating leases reported under current GAAP, the potential effects on financial statement analysis resulting from ASU 2016-02 can be projected. For valuation purposes specifically, the essential ratios to this process and the adjusted outputs from discount models can be calculated. While FASB has retained a dual classification for the treatment of leases, the IASB has elected a single classification that treats all leases as capital leases. Therefore, solely adjusting balance sheet valuation inputs will have an impact on lease accounting under both GAAP and IFRS, and adjusting both balance sheet and income statement inputs will have an impact under IFRS. Exhibit 2 illustrates financial statement adjustments to reflect operating leases; the left side shows profitability ratios without lease adjustments, and the right side shows profitability ratios with adjustments for operating leases.
EXHIBIT 2
Adjustments to Reflect Operating Leases (dollars in millions)
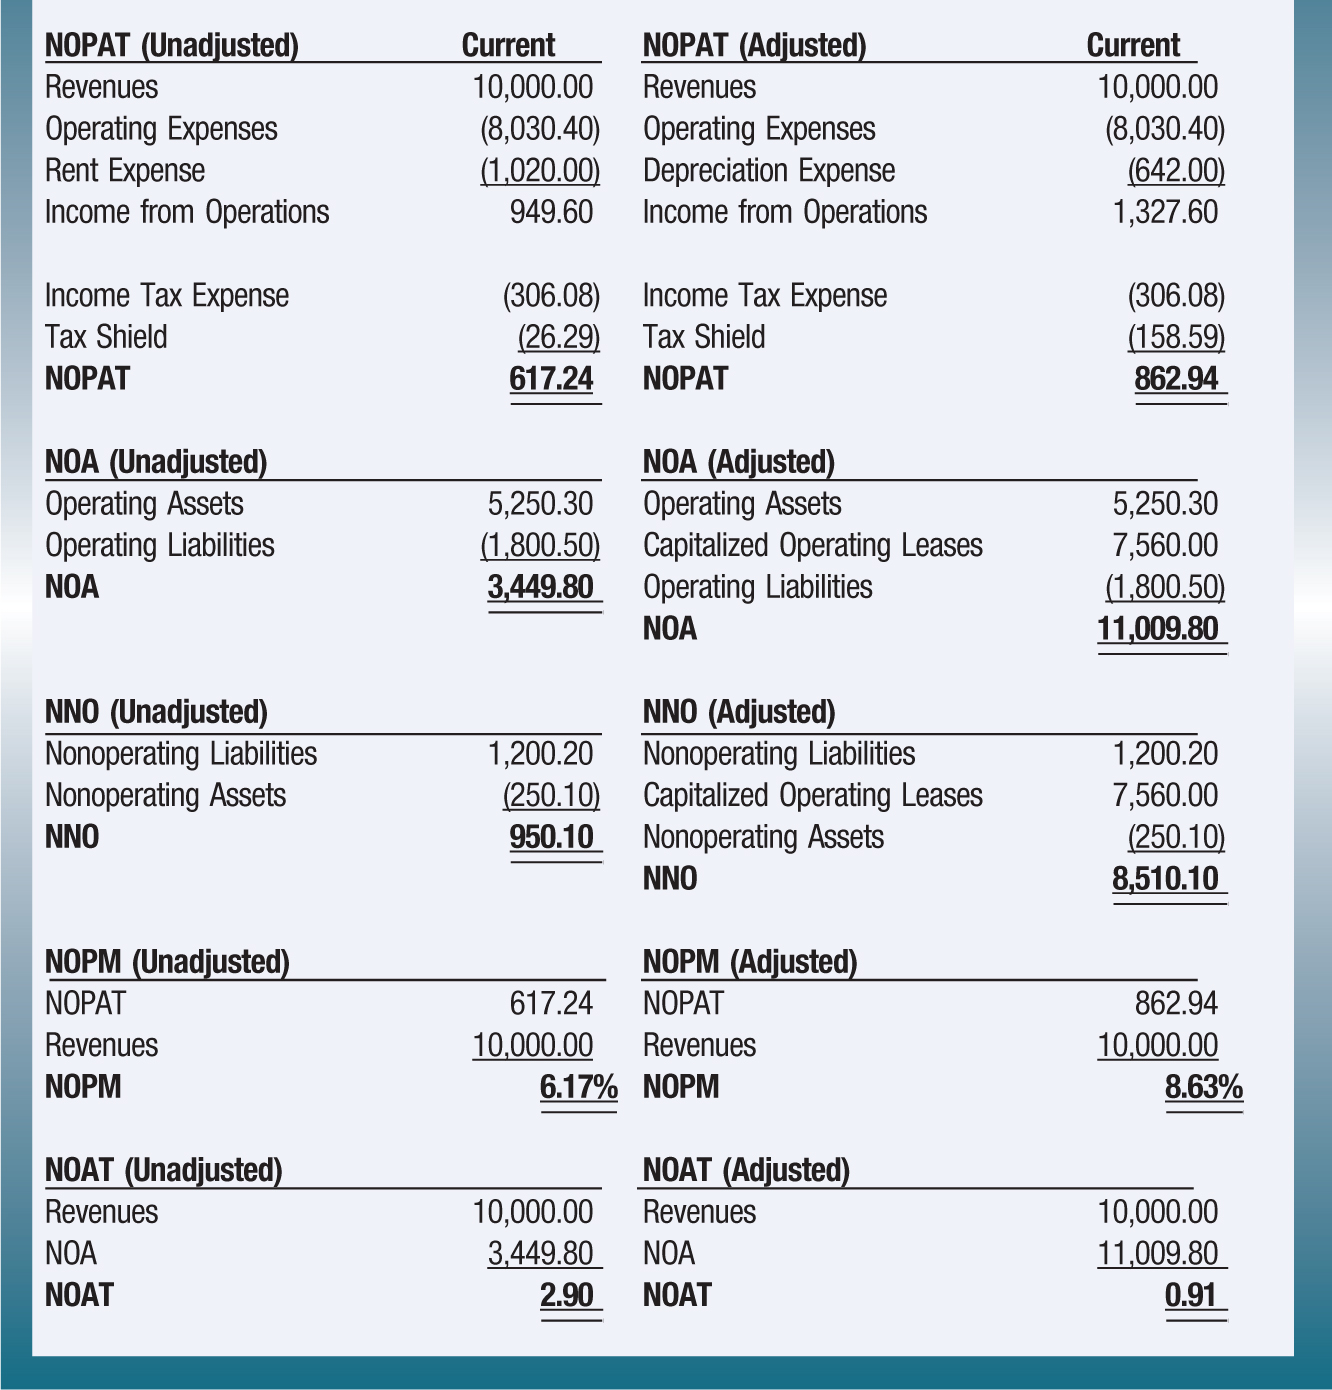
In this example, net operating profit after tax (NOPAT) increases from $617.24 million to $862.94 million when leases are classified as capital leases due to depreciation being the only associated operating expense. The depreciation expense is calculated as the difference between rent expense and the product of the estimated lease value and assumed cost of secured debt of 5.00%. Net operating assets (NOA) increase from $3,449.80 million to $11,009.80 million due to the additional leased assets, with no change in operating liabilities. Net nonoperating obligations (NNO) increase from $950.10 million to $8,510.10 million as a result of the lease adjustment to nonoperating liabilities, with no change in nonoperating assets. Net operating profit margin (NOPM), defined as NOPAT divided by revenue, increases from 6.17% to 8.63%, and net operating asset turnover (NOAT), defined as revenue divided by year-end NOA, decreases from 2.90 to 0.91 due to changes in NOPAT and NOA, while revenues remain unchanged.
Cost of Capital
Exhibit 3 presents the capital structure and weighted average cost of capital (WACC) for the hypothetical company, where the left side of the exhibit is unadjusted for operating leases and the right side shows the effect of all leases characterized as capital leases. Unadjusted intrinsic value is computed as the sum of the market value of debt and the market value of equity, where the market value of debt is assumed to equal the book value of debt ($1,200.20 million) and the market value of equity is assumed to be $5,538.73 million. Unadjusted for operating leases, debt represents 17.81% of intrinsic value and equity represents 82.19%. On an adjusted basis through the addition of the estimated operating lease values, debt represents 8.39% of intrinsic value, equity represents 38.74%, and the capitalized leases represent 52.87%.
EXHIBIT 3
Weighted Average Cost of Capital (dollars in millions)
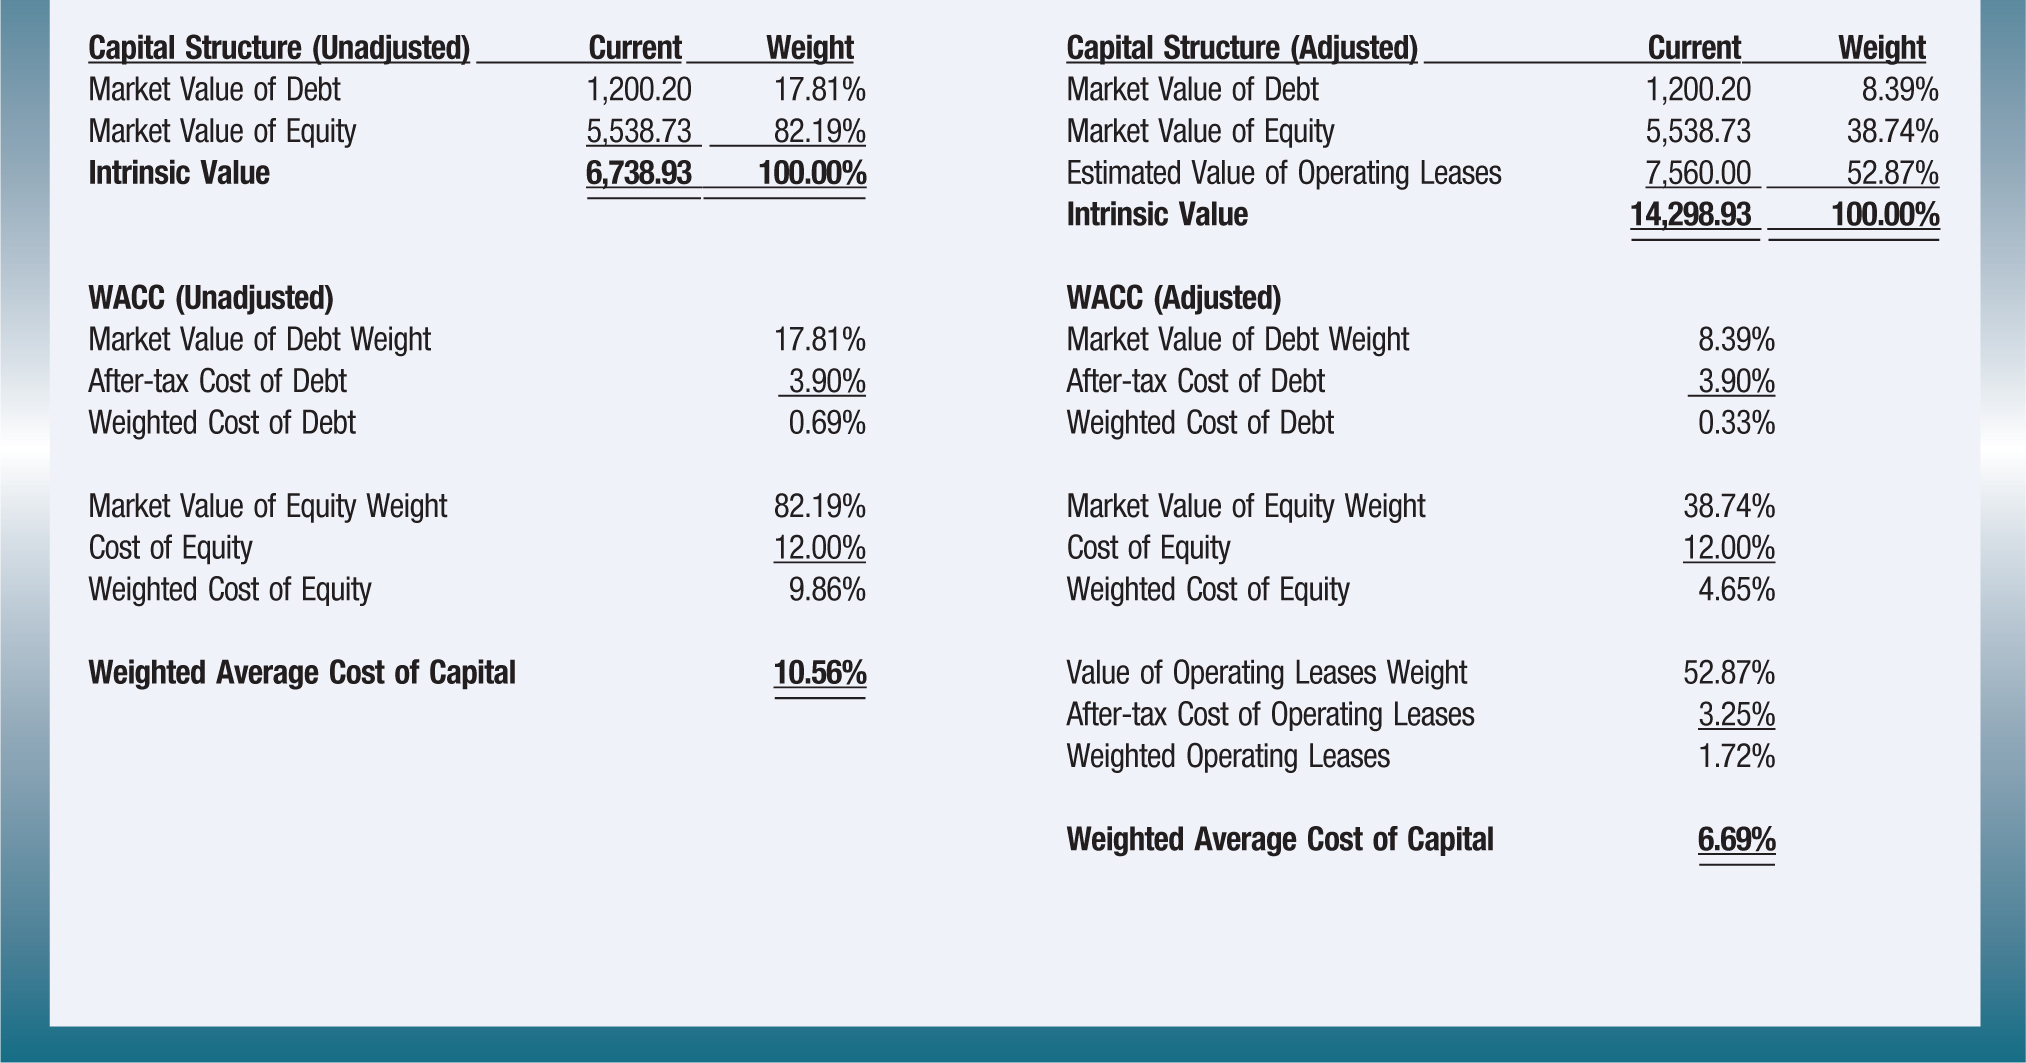
Unadjusted cost of capital includes a 0.69% weighted cost of debt and a 9.86% weighted cost of equity, for a WACC of 10.56%. The after-tax cost of debt is 3.90%, based on an assumed cost of unse-cured debt of 6.00% and an assumed tax rate of 35.00%. The cost of equity is assumed to be 12.00%, but in practice would be estimated using the capital asset pricing model. Adjusted cost of capital includes a weighted cost of debt of 0.33%, a weighted cost of equity of 4.65%, and weighted operating leases of 1.72%, for a WACC of 6.69%. After adjusting for operating leases, the cost of capital drops from 10.56% to 6.69%, due to the adjustments to the debt ratio.
Free Cash Flow and Equity Valuation
The discounted cash flow (DCF) model is an approach to valuing equity securities and focuses on projected free cash flows (FCF). In valuation, FCF is defined as operating cash flows net of the anticipated investments in NOA necessary to continue the business and discounted at the weighted average cost of capital to arrive at intrinsic value. Specifically, in this example, FCF equals NOPAT less the change in NOA, which represents the net cash flows available to creditors and shareholders. Unlevered FCF can also be defined as net cash flow from operations after estimated capital expenditures. Application of the DCF model to equity valuation in this example involves forecasting and discounting FCF for the horizon period and terminal period by the WACC, summing the present value of these forecasts to yield intrinsic value, and subtracting NNO to arrive at the value of equity.
Exhibit 4 presents equity valuation utilizing the DCF model. Panel A illustrates valuation using inputs unadjusted for operating leases, Panel B illustrates valuation using both balance sheet and income statement inputs adjusted for operating leases under IFRS, and Panel C illustrates valuation using only balance sheet inputs adjusted for operating leases under GAAP. These illustrations use conservative forecasting of NOPAT and NOA, and therefore FCF, for stock valuation. An assumed horizon revenue growth rate each year of 4.00% is used, along with an assumed 2.00% terminal growth rate. Terminal growth rates are normally set equal to an expected long-term growth rate in the economy. NOPAT is computed using forecasted revenue each year times current NOPM, and NOA is computed using forecasted revenue each year divided by current NOAT.
EXHIBIT 4
Free Cash Flow and Equity Valuation (dollars in millions)
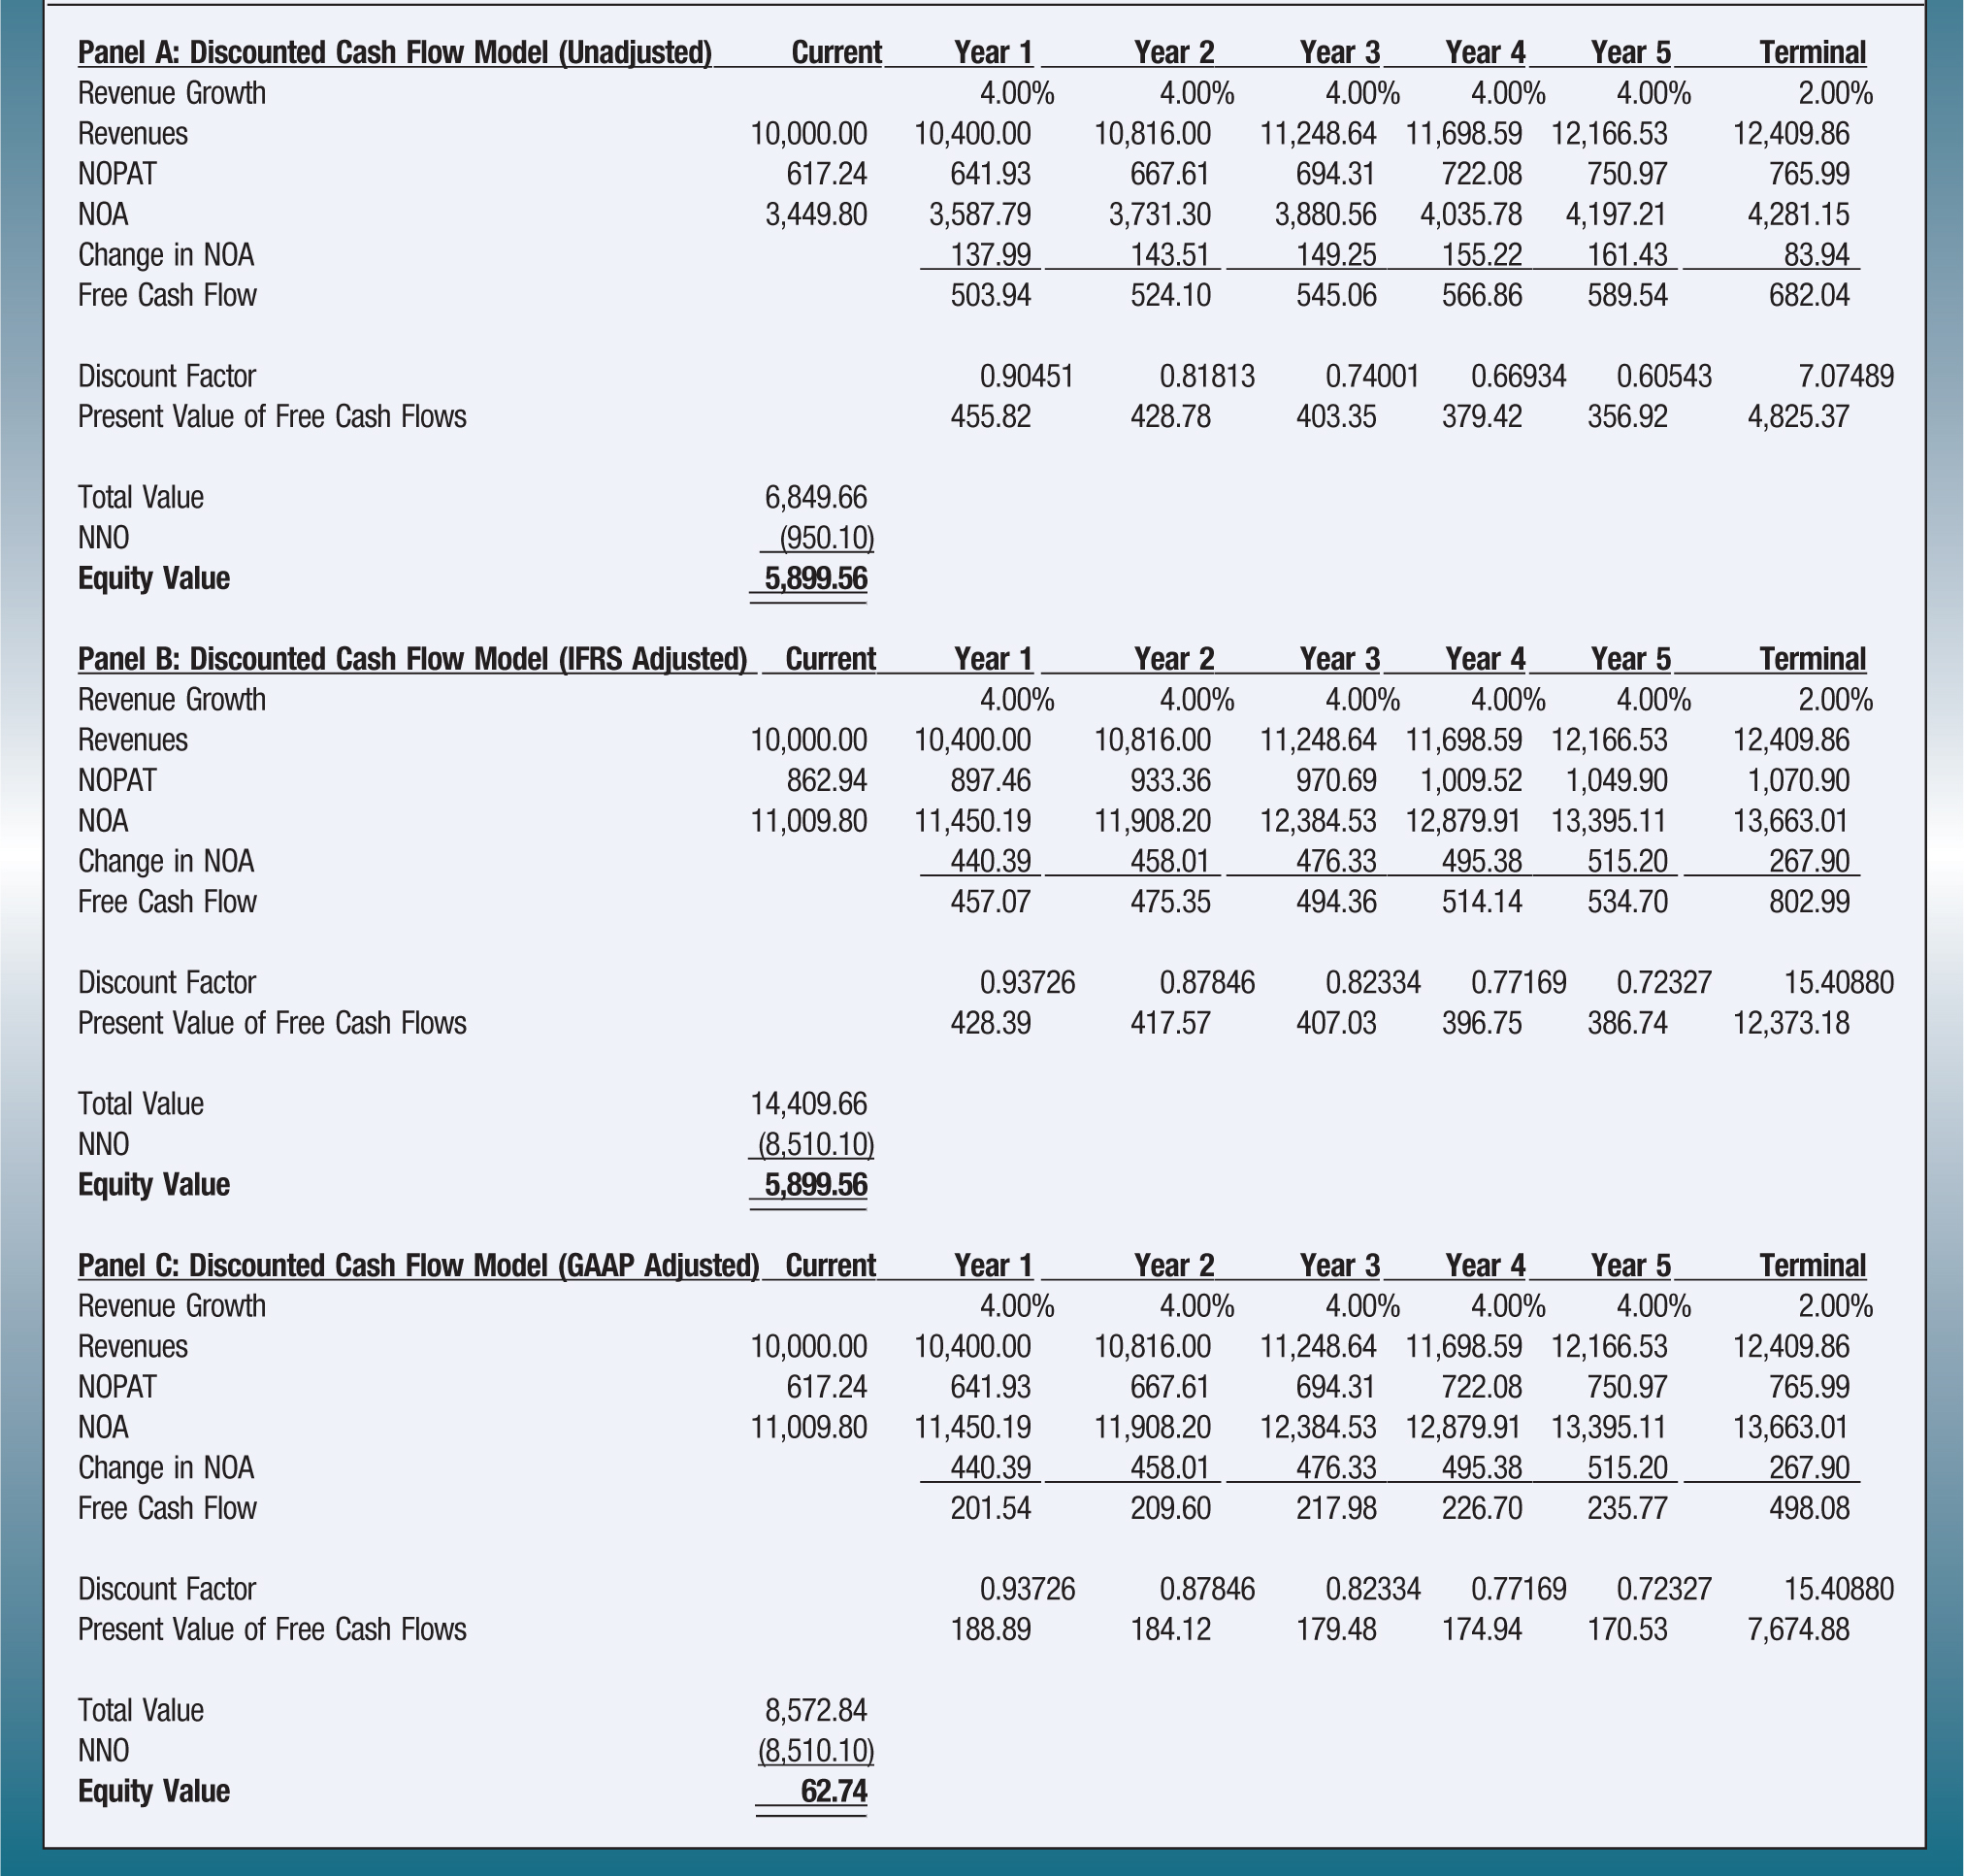
Using unadjusted NOPM (6.17%) and unadjusted NOAT (2.90) to forecast NOPAT and NOA, and an unadjusted WACC of 10.56% as the discount rate, Panel A yields total value of $6,849.66 million. Subtracting unadjusted NNO ($950.10 million) yields an equity value of $5,899.56 million. This is the DCF equity valuation output utilizing model inputs based on current GAAP lease accounting (i.e., operating leases are not reported on the balance sheet and operating lease payments are recorded as rent expense on the income statement). Using adjusted NOPM (8.63%) and adjusted NOAT (0.91) to forecast NOPAT and NOA, and an adjusted WACC of 6.69% as the discount rate, Panel B yields total value of $14,409.66 million. Subtracting adjusted NNO ($8,510.10 million) yields an equity value of $5,899.56 million. This is the DCF equity valuation output using model inputs based on the new IFRS lease accounting, where all leases are treated as capital leases on both the balance sheet and income statement.
Using unadjusted NOPM (6.17%) and adjusted NOAT (0.91) to forecast NOPAT and NOA, and an adjusted WACC of 10.56% as the discount rate, Panel C yields total value of $8,572.84 million. Subtracting adjusted NNO ($8,510.10 million) yields an equity value of $62.74 million. This is the DCF equity valuation output using model inputs based on the new GAAP lease accounting, where operating leases are reported on the balance sheet and operating lease payments are recorded as rent expense on the income statement.
The Law of Unintended Consequences
Economically, operating leases are no different from traditional asset ownership and debt. Omitting assets and liabilities associated with operating leases from the balance sheet biases financial ratios, leading to potential unreliable competitive benchmarking. Estimating equity valuation using inputs based on the new GAAP treatment of leases and a combination of adjusted and unadjusted metrics could lead to possible mismeasurement in the DCF model output. There is, however, no effect on free cash flow to equity from classifying all leases as capital leases, because the increase in capital asset expenditures as a result of the change in the present value of operating lease expenses is counterbalanced by the increase in net nonoperating obligations created by the capitalization (as long as necessary adjustments are made to the cost of capital and debt level, debt ratios remain stable, and operating leases are fairly valued).
Capitalizing operating leases on both the balance sheet and income statement is a common method used to present an alternate view of investing and financing activities that reflects leases under current GAAP in order to provide off–balance sheet adjustments for financial statement analysis. Corporate stakeholders pay attention to the composition of the balance sheet and its alignment with the income statement; this extends to their analysis and valuation of equity and debt securities.
This article illustrates the potential effects on equity valuation using the discounted cash flow model and the inputs involved from the impending changes to lease accounting, particularly with respect to lease treatment on the income statement. Because the capitalization of all leases on both the balance sheet and income statement is an accepted method for financial statement analysis, CPAs will want to take any appropriate adjustments deemed necessary regarding dual-classification versus single-classification treatment of leases under U.S. GAAP or IFRS, and the implications for equity valuation into consideration when estimating cash flows, cost of capital, and equity.
Matthew A. Stallings, PhD is an assistant professor of accounting in the Opus College of Business at the University of St. Thomas, St. Paul, Minn.